Portal
SQLBench's web base portal allows you to view your database performance statistics from anywhere.
Current and historic trends are quickly at your fingertips, without needing to log on to your server.
Easily share performance information with DBAs, Database Developers, IT Ops, software vendors or infrastructure partners.
Top Queries
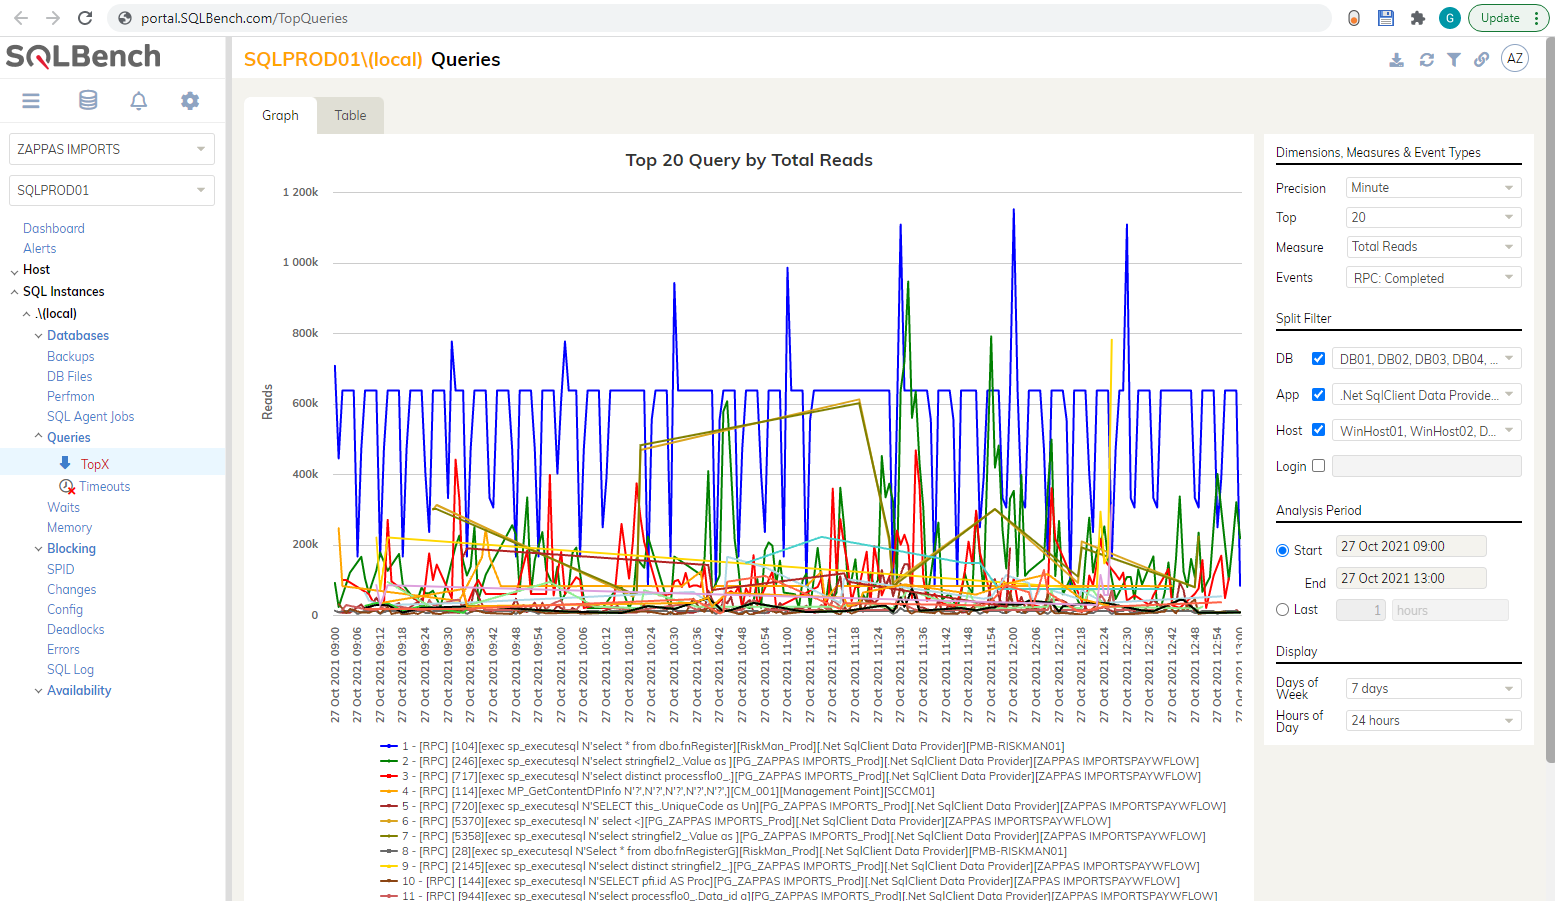
SQLBench's Top Queries feature lets you dig deeply into your query workload, quickly identifying the slowest or most expensive queries.
Filtering options include Database, Application Name, Host Name and Login Name
Top Dimensions include Duration, Reads, CPU and Execution Count

SQL Waits
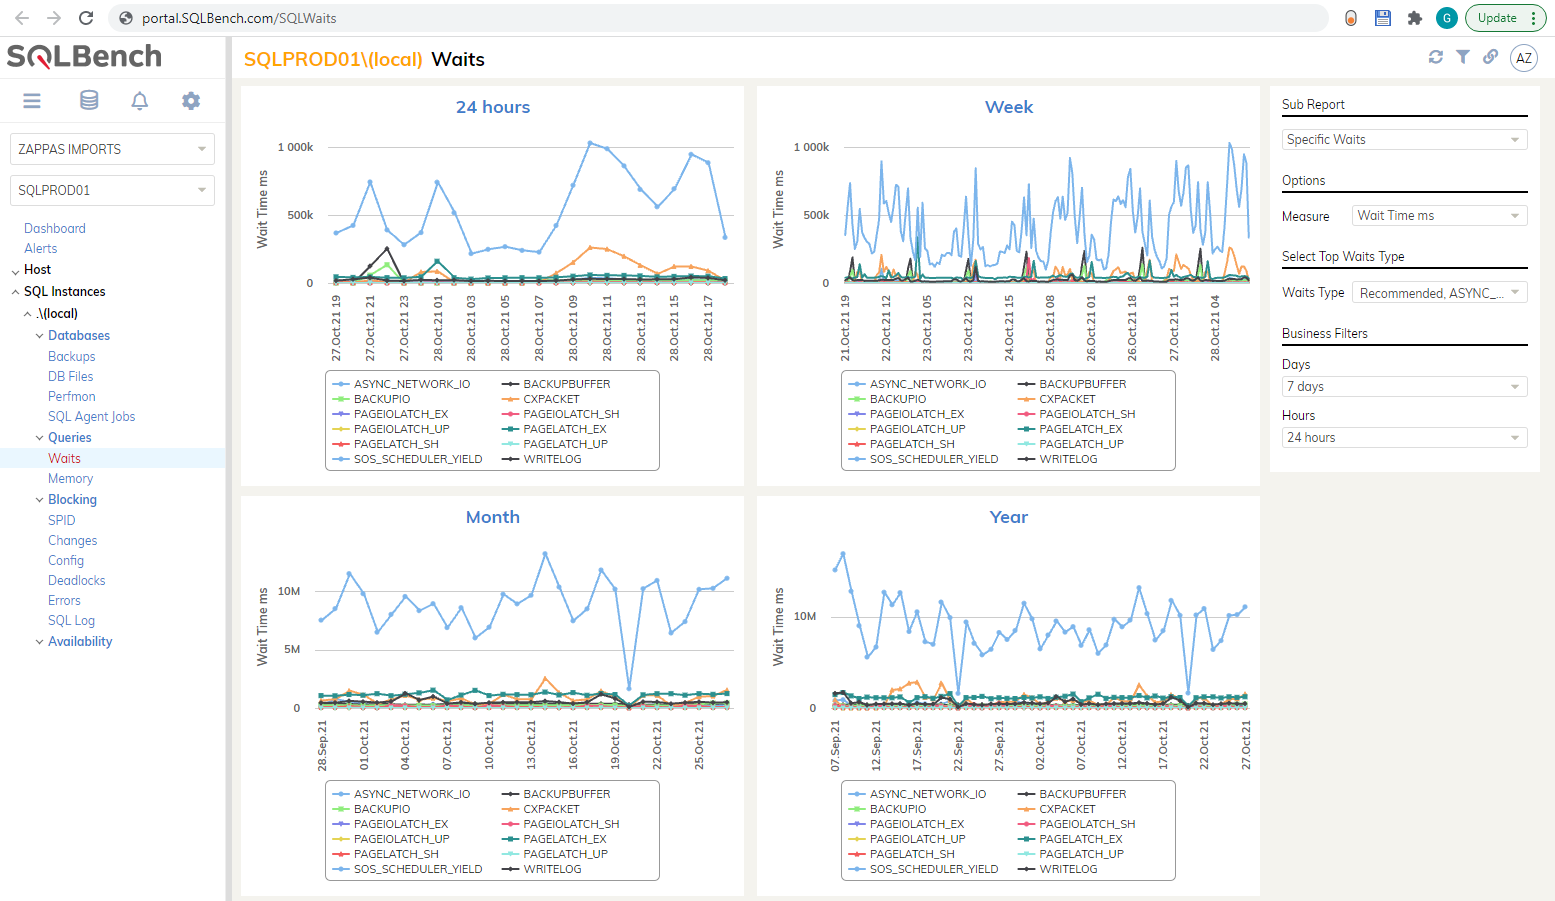
SQL Waits are an important source of SQL Server perfomance telemetry, which allow you to see where time is lost "waiting" for database tasks to complete
SQLBench offers a full list of SQL Waits

CPU usage
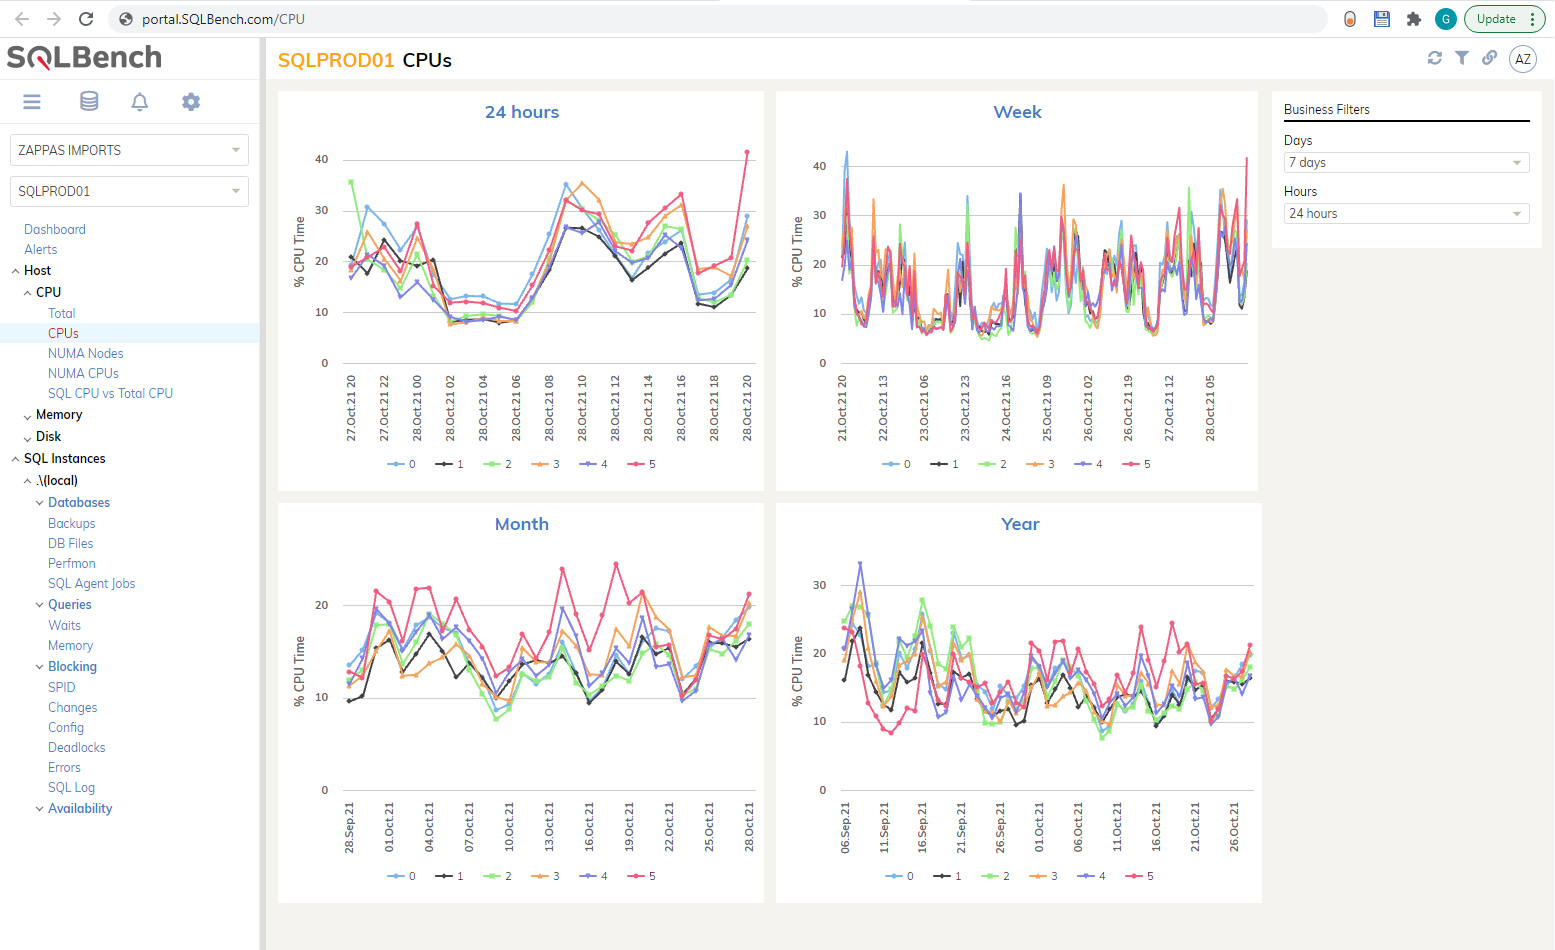
SQLBench's CPU usage report allows you to view utilisation of CPUs
SQLBench offers CPU, CPU Numa Node, CPU Numa CPU and SQL Process CPU vs CPU reports
